LinkedIn Analytics
See what's actually working
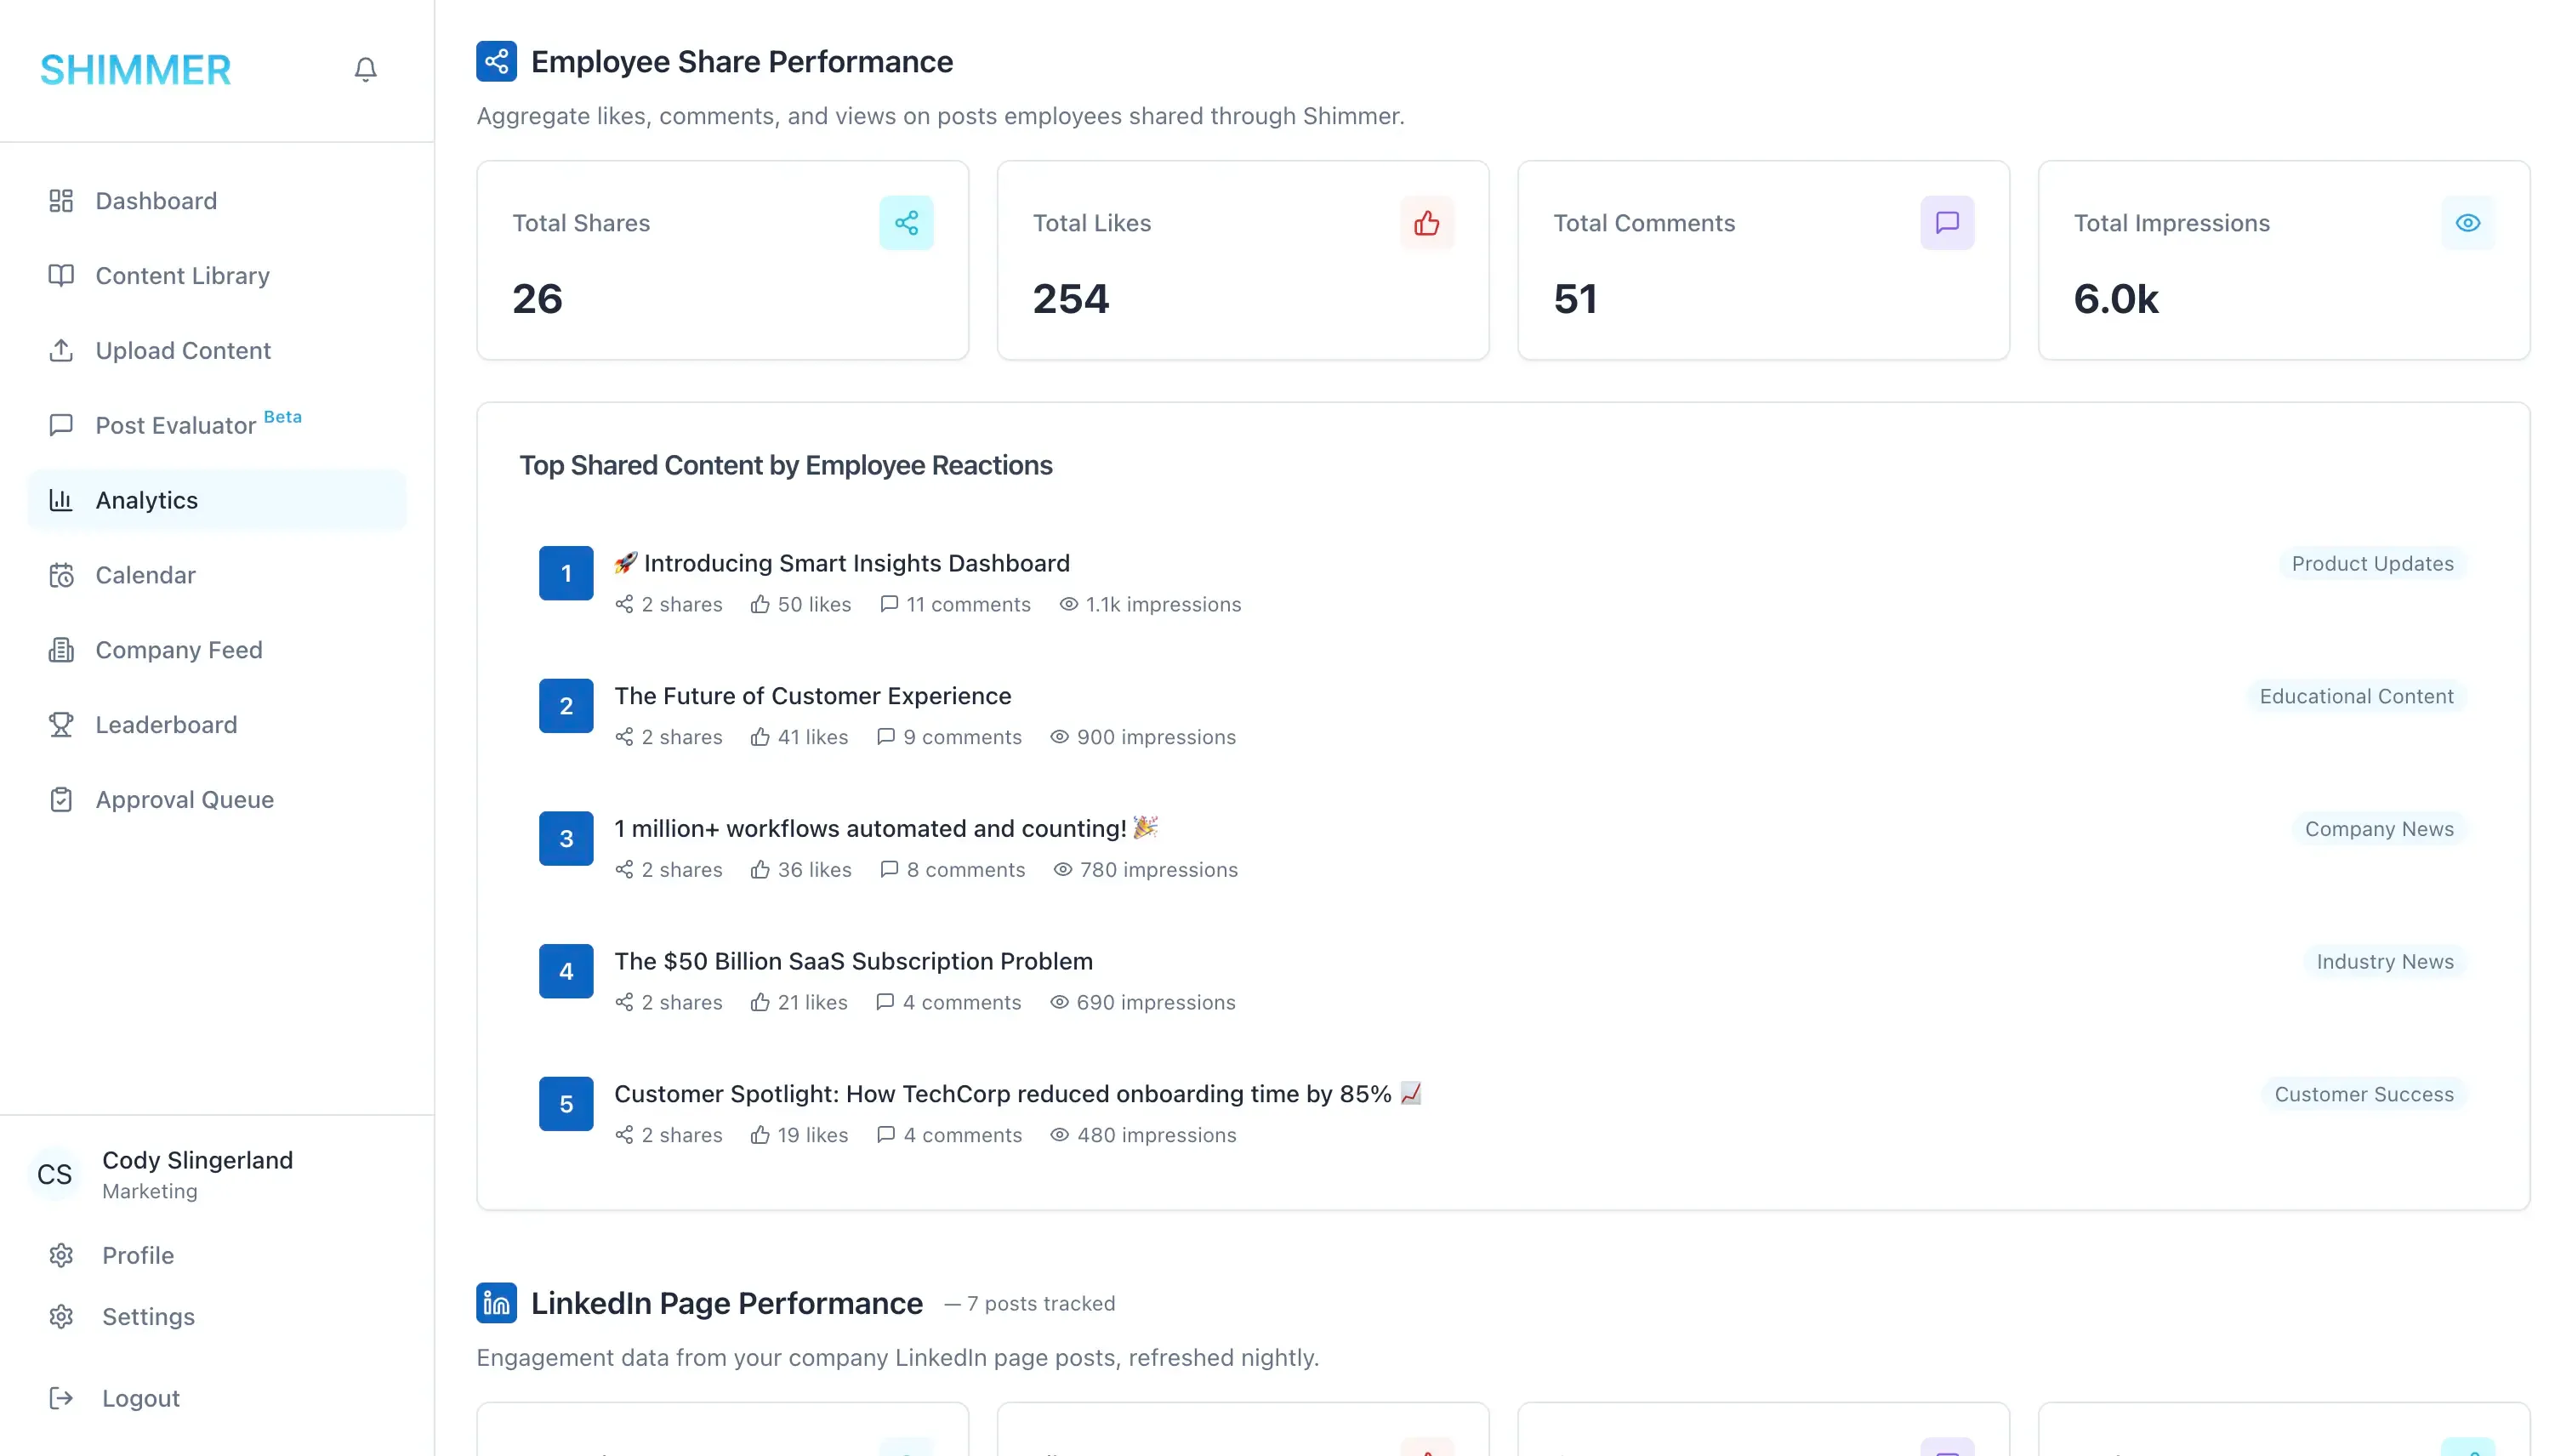
Every share, view, and comment tracked in one dashboard. Know which content lands and who's driving reach.

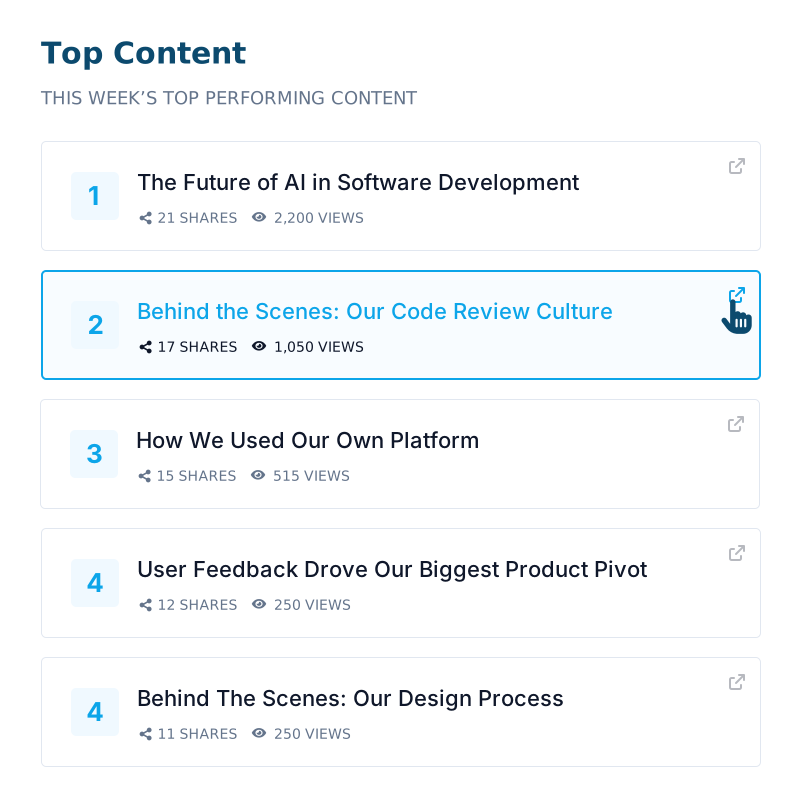
From shares to signal
Track every post's performance
See exactly how each piece of content performs after it is published to LinkedIn. No more guessing what resonates.
- Shares, views, and comments
- Post-by-post breakdown
- Engagement trend lines

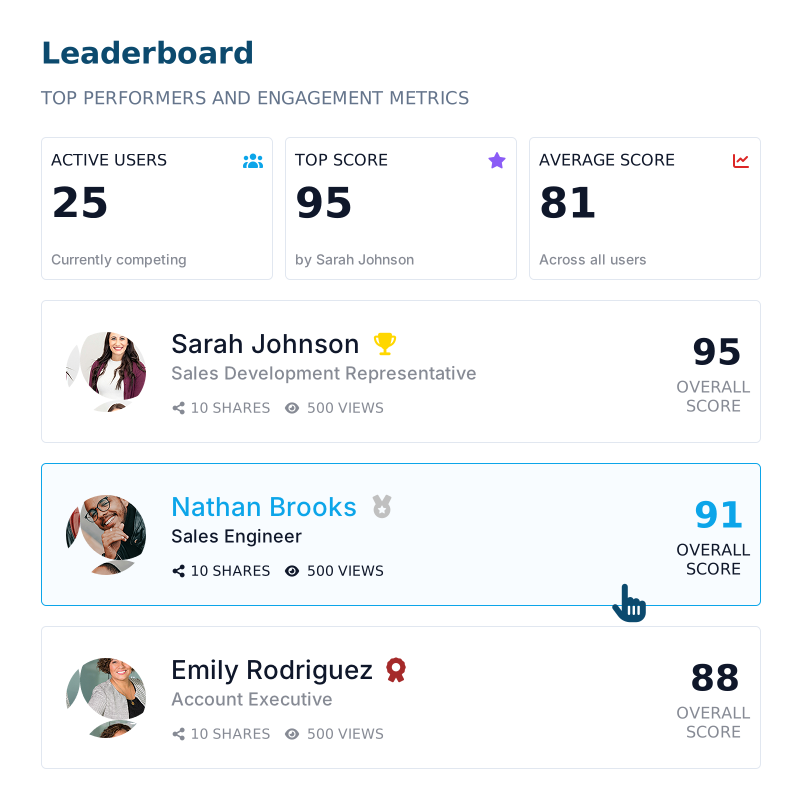
Friendly competition, real results
Turn engagement into a leaderboard
Real-time rankings show who's sharing and how often, filtered by week, month or all-time to fit however you run your program.
Live rankings
Updated as shares happen, no refresh needed.
Team filters
Slice by team, group, or time period.

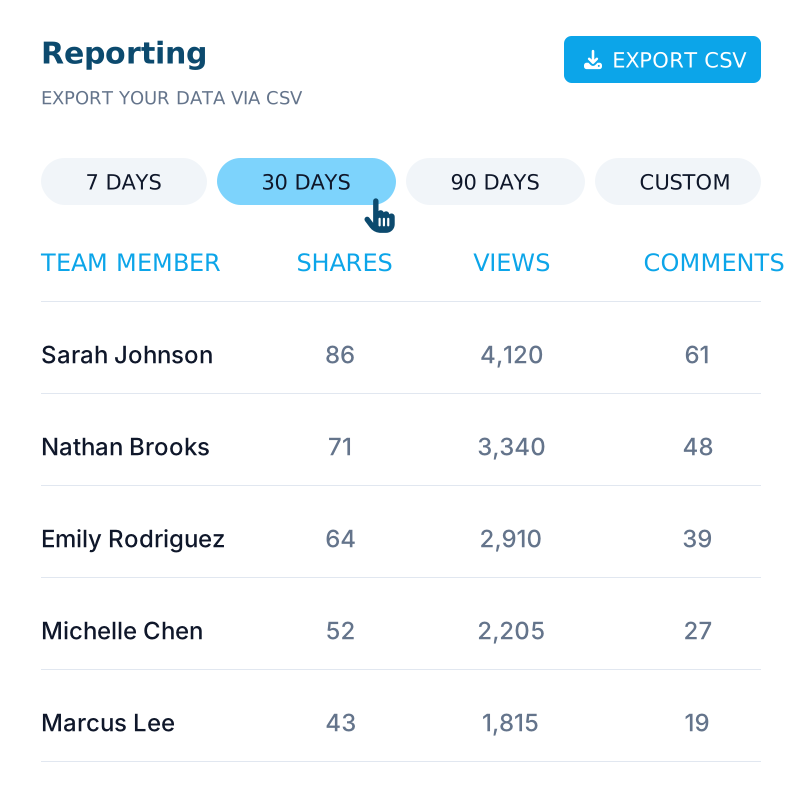
Numbers your team can act on
Export data your way
Pull historical trends into a report built for the room you're presenting to, whether that's a Monday standup or a board deck.
- One-click CSV export
- Historical trend lines
- Custom date ranges
FAQ
Have questions? We have answers
Shimmer tracks content performance metrics like shares, views, comments, and engagement trends, plus usage analytics showing who on your team is engaging with your content over time.
Yes. Leaderboards and reports can be filtered by week, month, or all-time, and broken down by team or group so you can see performance at whatever level you need.
Admins get full analytics access and platform-wide visibility. Access for other roles depends on your organization's permission settings, so you control who sees what.
Yes. Reports can be exported as CSV for custom analysis, executive presentations, or anywhere else your team needs the numbers outside the dashboard.
Shimmer's dashboard shows which content gets shared and engaged with most, so marketing and sales teams can see what's resonating and double down on it.